IFS and Power BI: Creating Advanced Manufacturing Dashboards
In today’s data driven manufacturing landscape, decision makers need more than just raw numbers, they need insights. Integrating IFS (Industrial and Financial Systems) with Power BI transforms complex enterprise data into visual stories that fuel smarter decisions on the factory floor and in the boardroom.
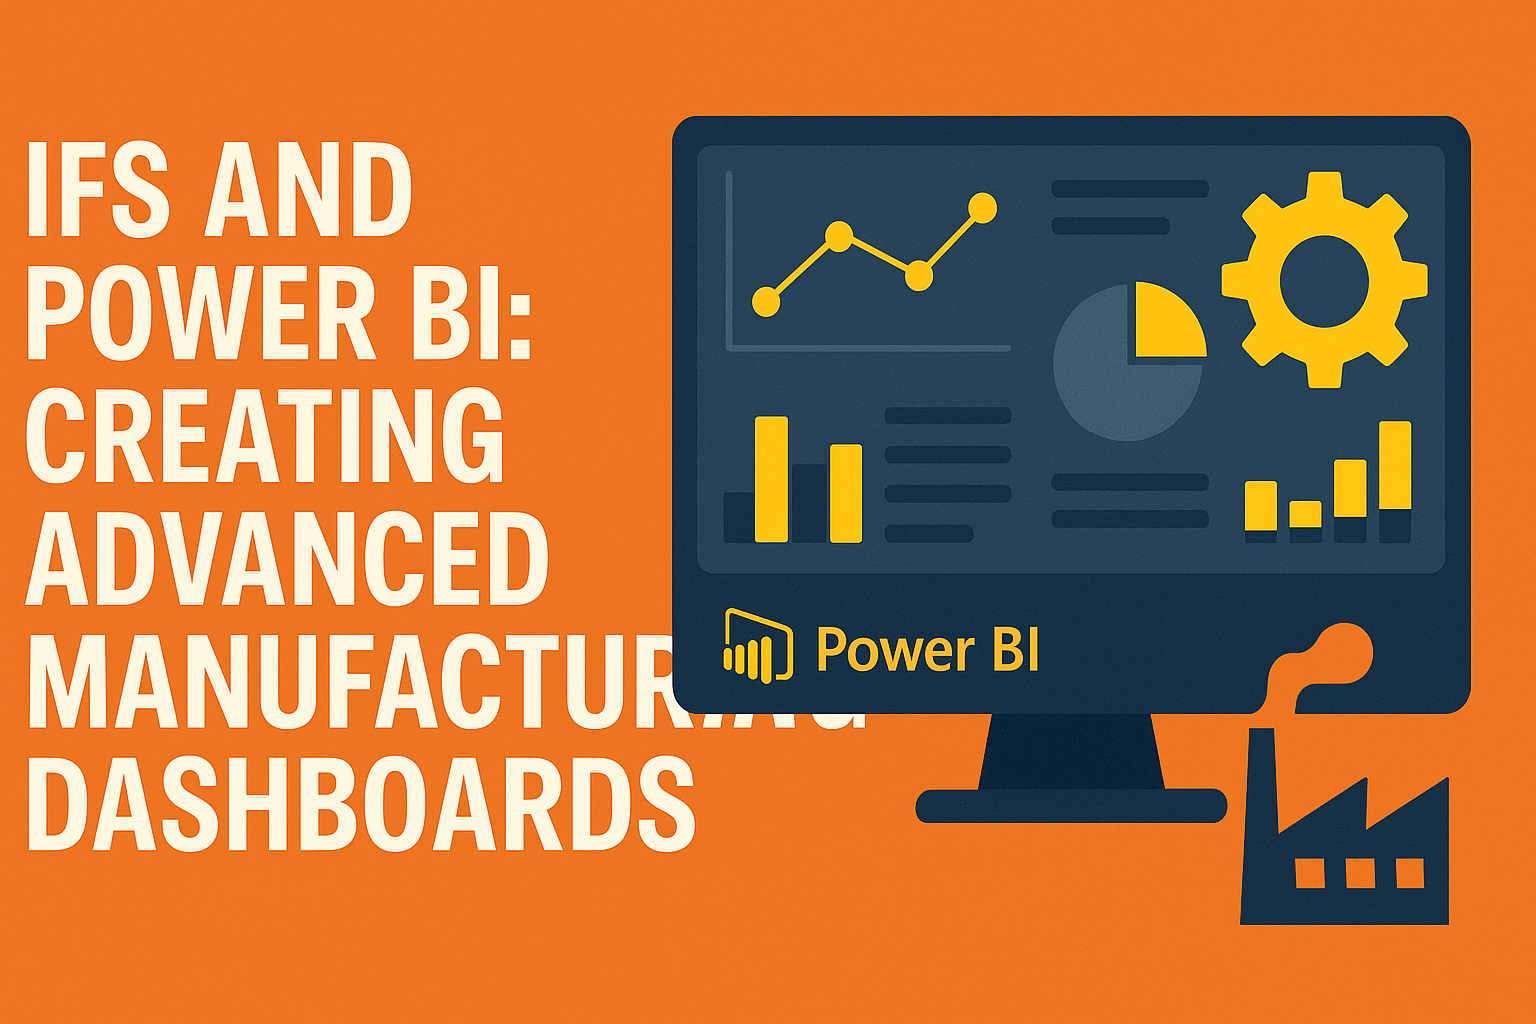
At JumpModel, we specialize in unlocking the full potential of your IFS ecosystem. One of the most powerful ways to do that? Seamless integration with Microsoft Power BI to create advanced manufacturing dashboards tailored to your KPIs.
Why Connect IFS with Power BI?
IFS Applications is a powerhouse ERP system used by manufacturers worldwide for managing operations, from production and inventory to finance and asset maintenance. But while IFS has robust built-in reporting tools, many companies struggle with:
- Limited visualization capabilities
- Static, hard-to-navigate reports
- Delayed data refresh cycles
- Difficulty comparing KPIs across departments
That’s where Power BI steps in.
Power BI allows users to connect directly to IFS data (via APIs, OData, or intermediate databases), build real-time dashboards, and visualize operations with clarity and context.
What Makes a Great Manufacturing Dashboard?
When working with clients across North America, we often get asked: “What should go into a manufacturing dashboard?”
Here’s what we recommend:
1. Production Efficiency Metrics
- OEE (Overall Equipment Effectiveness)
- Downtime trends by machine or shift
- Scrap rates and rework frequencies
2. Inventory & Supply Chain Insights
- Inventory turnover ratios
- Stock aging reports
- Vendor delivery performance
3. Work Order Visibility
- Backlog and completion tracking
- Time-to-completion by work center
- Exceptions and bottlenecks in real-time
4. Financial Performance
- Cost of goods manufactured
- Budget vs. actual for production lines
- Forecast accuracy for demand planning
Real-Time Insights = Real-World Impact
Imagine a plant manager walking into a morning meeting and seeing:
- Yesterday’s production shortfalls at a glance
- The specific shift where an unplanned outage occurred
- Supplier delays impacting next week’s runs
- Overtime costs projected to exceed monthly targets
With a custom Power BI dashboard pulling live data from IFS, this kind of decision-making becomes effortless—and proactive.
Common Challenges (and How JumpModel Solves Them)
Data Mapping Complexity
IFS is highly customizable. Mapping the right tables and views to Power BI can be overwhelming.
Our Solution: We’ve developed pre-configured templates and connectors specific to IFS versions, reducing integration time and ensuring clean, accurate data.
Performance & Latency
Large datasets can slow down reports and dashboards.
Our Solution: We apply optimized data models, summary tables, and incremental refresh techniques to keep performance smooth, even with millions of rows.
Security & Access Control
Role-based access to sensitive operational data is crucial.
Our Solution: We implement row-level security within Power BI to ensure each user only sees what they’re permitted to.
Ready to See It In Action?
Whether you’re trying to reduce lead times, increase throughput, or just gain better visibility across your operations, a well-built Power BI dashboard connected to your IFS backend can drive massive ROI.
At JumpModel, we don’t just implement dashboards, we engineer decision intelligence.